
Calculating marginal effects semi-parametrically in Stata
Here is a program in Stata to calculate the marginal effects of one variable on another in a semi-parametric way. There are two .ado files and a Stata help file. It relies on the lpoly method, then numerically calculates the derivative of the function. This process is repeated to bootstrap the standard errors. The output of the function is a graph showing the 95% confidence interval around the marginal effects.
To see what the program does, consider the following example. We set
while and
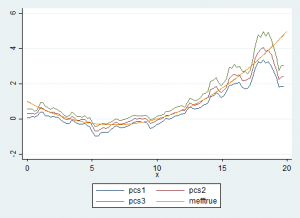
Therefore, the marginal effect of x is .03×2−.4x+1
We can then run semipmarginal y x z, ndiff3) nbstrap) graphname(“graph”) datname(“data”)
to do 100 bootstrap runs of the semi-parametric regression.
We can see that for this example, the program fairly accurately finds the marginal effect, except at the edges of the support of x, which is a typical weakness of non-parametric regression.

Note that the files are still a beta version and there could be bugs. In particular, when the x variable is sparse on the edges of the support, it can fail.
Do you have any type of tips for writing articles?
That’s where I always struggle and I just wind up staring vacant display for very
long time.